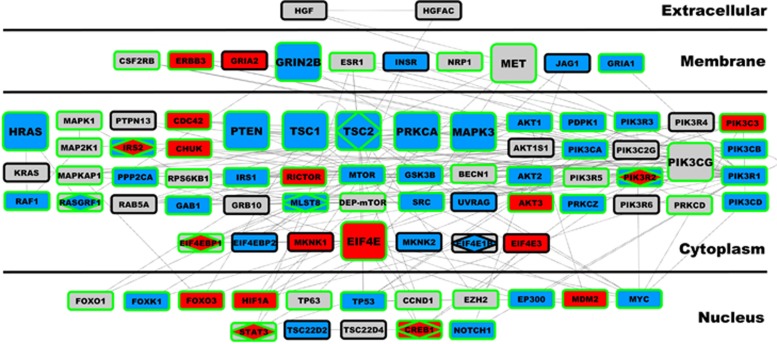
Figure 4.
Canonical network encompassing the PI3K–TSC1/2–mTOR–EIF4E axis. This figure depicts all 84 genes comprising the shortest canonical network path of the PI3K–TSC1/2–mTOR–EIF4E axis, as defined by the MetaCore GeneGO database. The plot is arranged by cellular compartment for each protein in the network. Nodes were depicted in larger size if they are members of the autism spectrum disorder (ASD)-associated gene list compiled by SFARI Gene. Nodes with green borders are direct targets of the ASD co-expression module M25, which is ASD-upregulated and enriched in translation initiation and is preserved within the MIA dataset. Each node is colored on the inside to indicate directionality of differential expression (blue=downregulated, red=upregulated, gray=not differentially expressed). Rectangular shapes characterize all genes within this network. However, within each node a diamond shape indicate that the gene was differentially expressed in ASD brains. MIA, maternal immune activation.

