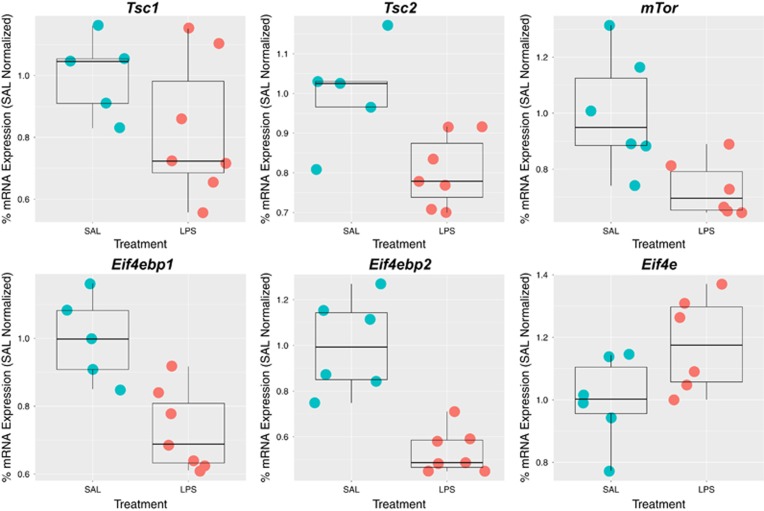
Figure 5.
Cross-species validation of dysregulated gene expression within the Tsc1/2–mTor–Eif4ebp1/2 axis in a mouse MIA model. This figure summarizes the results from qRT-PCR analysis of gene expression along the Tsc1/2–mTor–Eif4ebp1/2 axis hypothesized to show dysregulation from the previous rat model data. Each gene is displayed with a scatter-boxplot and gene expression for each individual sample is plotted on the y-axis as % mRNA expression normalized to the average value in the SAL condition. Boxplots show the median and interquartile range (IQR; Q1=25th percentile, Q3=75th percentile), as well as the outer fences (Q1 – (1.5IQR) and Q3+(1.5IQR)). MIA, maternal immune activation; SAL, saline.

