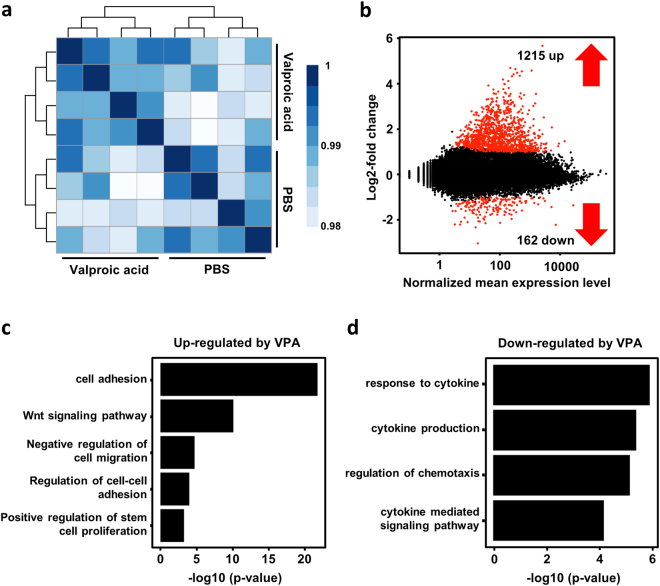
Figure 8.
Gene expression profiling revealed induction of cell adhesion pathways and reduced expression of genes involved in chemotaxis. (a) Heat map of a sample-to-sample Pearson correlation and dendrogram showing sample-to-sample correlation. All biological replicates cluster well with each other, and all samples from different populations are clearly separated from each other (analysis by R). (b) The red dots represent differentially expressed genes (DEG) by VPA treatment (1% false discovery rate). (c,d) GO pathway analysis for differentially expressed genes. Plots show biological processes that are associated with genes that are up- or down-regulated in VPA treated CD34+ cells.

