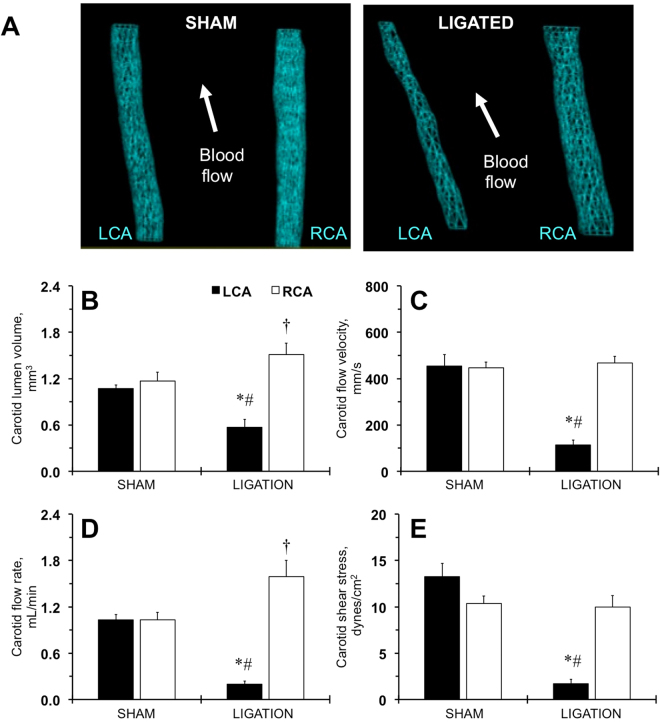
Figure 1.
Hemodynamic changes in carotid arteries determined by ultrasound in FVB mice two weeks after ligation. (A) Representative 3D-images of the lumen of the sham-operated (SHAM) or ligated (LIGATED) mice. LCA, left carotid artery. RCA, right carotid artery. Arrows show direction of the blood flow. (B) Carotid lumen volume, mm3. (C) Carotid blood flow velocity rate, mm/s. (D) Carotid blood flow volume rate, mL/min. (E) Carotid shear stress, dynes/cm2. Black bars are LCA. Open bars – RCA. SHAM and LIGATED mice are shown on X-axis. Values are mean ± SEM. *p < 0.05 vs. LCA, SHAM. †p < 0.05 vs. RCA, SHAM. #p < 0.05 vs. RCA, LIGATED. n = 5–6 per group.

