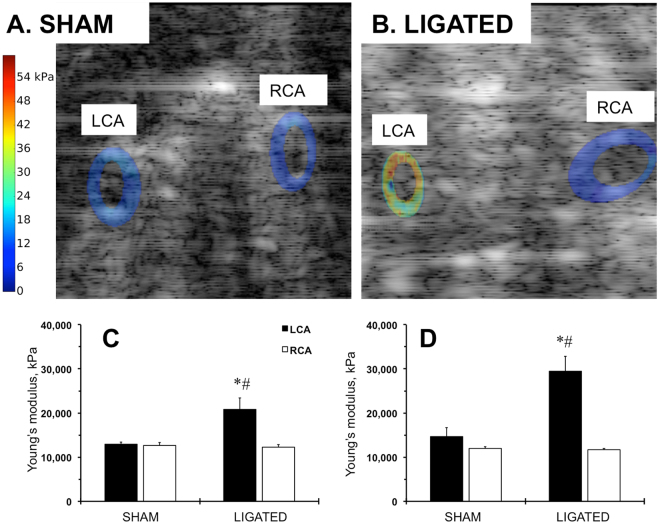
Figure 3.
Elastography profiles of the carotid arteries in FVB mice after ligation. (A) Computed sonograms of the carotid arteries at 2 weeks after sham operation. (B) Computed sonograms of the carotid arteries at 2 weeks after ligation. LCA, left carotid artery. RCA, right carotid artery. The Young’s modulus is color-coded: lowest (zero) is set in blue; highest value (54 kPa) is in red. (C) Quantitative analysis of the Young’s modulus at 1 week post-surgery. (D) Quantitative analysis of the Young’s modulus at 2 weeks post-surgery. Black bars – LCA. Open bars – RCA. SHAM and LIGATED mice are shown on X-axis. Values are mean ± SEM. *p < 0.05 vs. LCA, SHAM. #p < 0.05 vs. RCA, LIGATED. n = 5 per group.

