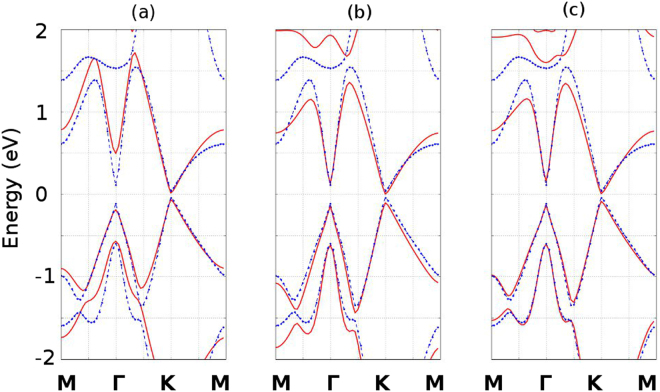
Figure 3.
Monolayer stanene bandstructure with the spin orbital coupling effect: comparison between the DFT calculation and our tight binding model. The blue dotted lines represent the bandstructure calculated by means of DFT with spin orbital interaction, whereas the red solid lines represent the bandstructure calculated by means of our tight binding model. (a), (b) and (c) represent the comparisons for the NNTB, 2NTB and 3NTB models, respectively.

