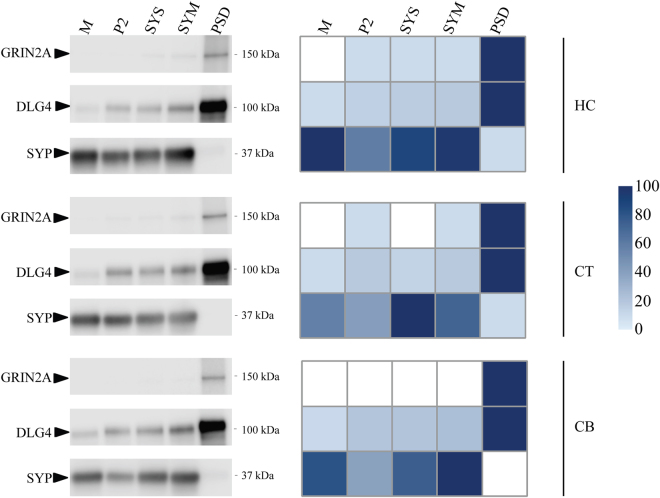
Figure 3.
Protein abundance distribution over the cellular sub-fractions in hippocampus (HC), cortex (CT) and cerebellum (CB). Left panel is an immunoblot analysis showing the presence of presynaptic protein SYP, and postsynaptic proteins GRIN2A and DLG4 in each sub-fraction. Right panel shows protein abundance in each sub-fraction as observed with proteomics. Mass spectrometry protein abundance values were scaled between zero and 100% of their maximum over all sub-fractions in each panel and accordingly color-coded from light-blue to dark-blue.

