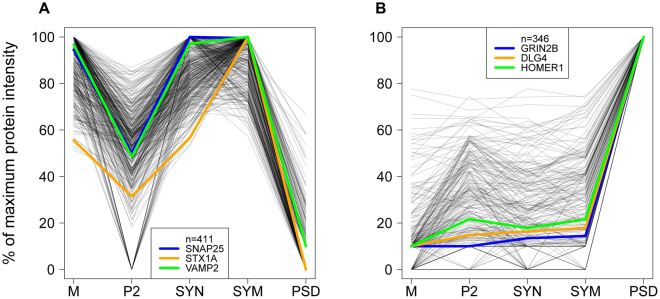
Figure 4.
Correlation analysis of abundance profiles of proteins over sub-fractions of the hippocampus with selected seed proteins. In each panel, three functionally related seed proteins were chosen typical for each of the specific synaptic processes in (A) and (B). Proteins shown have a Pearson correlation of at least 0.9 with at least two out of these three seed proteins. Protein abundances are scaled between zero and their maximum intensity over all selected sub-fractions. This leads to A) exocytosis, 411 proteins and B) postsynaptic density, 346 proteins.

