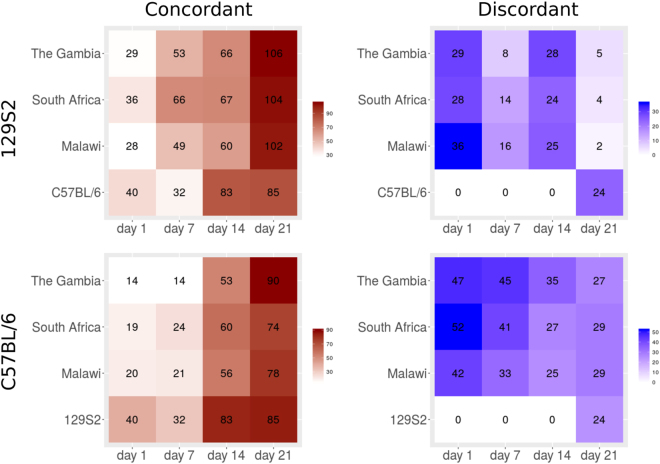
Figure 2.
Module counts in comparisons of different human and mouse data sets. Red color refers to concordant and blue to discordant modules. Upper panel: Comparisons of 129S2 mouse strain data with human data sets from cohorts from The Gambia, South Africa, Malawi and with C57BL/6 mouse strain. Lower panel: Comparisons of C57BL/6 mouse strain data with human data sets from cohorts from Gambia, South Africa, Malawi and with 129S2 mouse strain.

