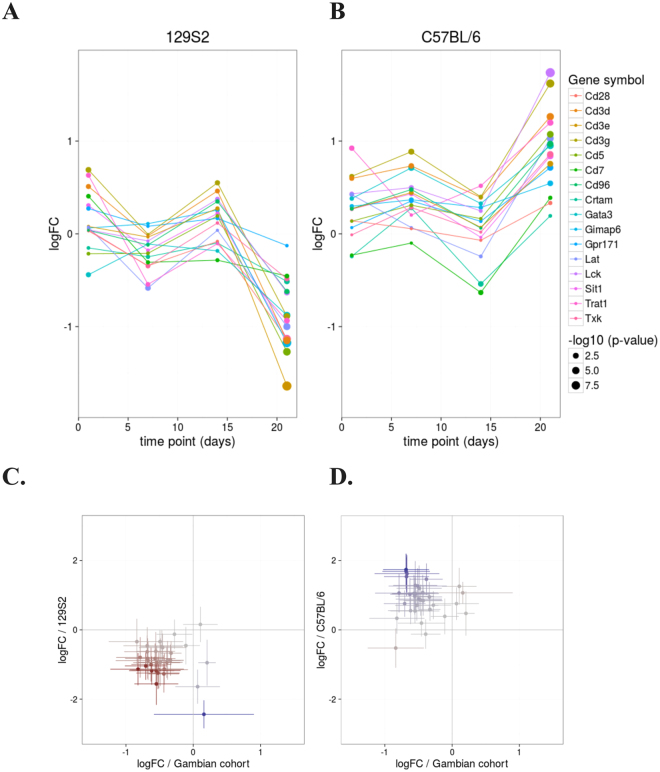
Figure 3.
T-cell related genes with opposite expression pattern in 129S2 and C57BL/6 mouse strains. (A) Expression changes of selected genes belonging to the modules “enriched in T cells (I)”, “T cell activation and signaling” and “T cell activation (I)” at the time points day 1, day 7, day 14 and day 21 p.i. The selected genes drive the differences in the patterns of T-cell expression changes in 129S2 and C57BL/6 mice. (B) Log2FC of the set of 16 genes plotted for 129S2 or C57BL/6 mouse data vs. data from patient cohort from Gambia. Bars represent 95% confidence intervals (CI) for the log fold change.

