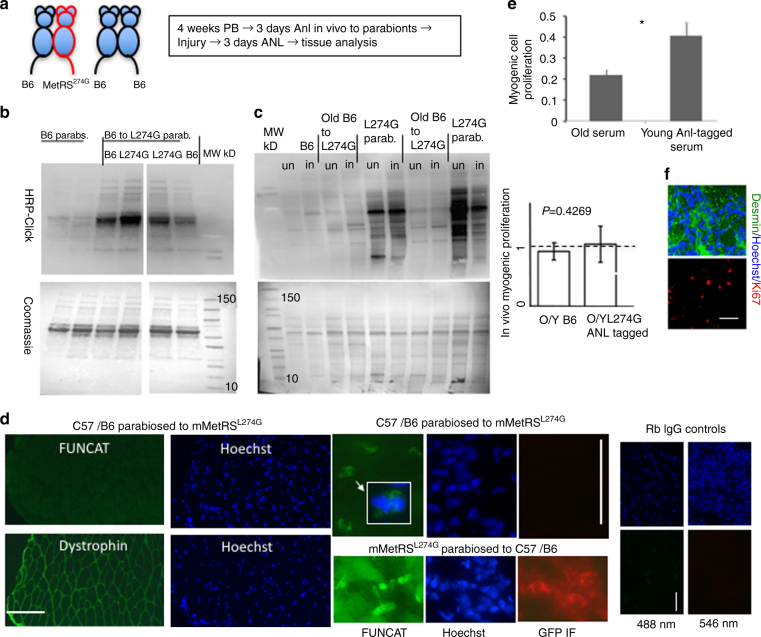
Fig. 4.
Bio-orthogonal proteome labeling in the setting of heterochronic parabiosis. a Schematic representation of the study. b Click-western blotting on serum proteins from the heart-bleeds of MetRSL274G parabionts and their C57BL/6 partners and the negative control syngeneic C57BL/6 pairs. c Click-western blotting resolved the robust selective in vivo ANL-labeling of the proteomes from uninjured (un) and injured (in) Gastrocnemius muscle of MetRSL274G parabionts (Parabs) and much lower ANL-labeling of proteins that were derived from muscle of their C57BL/6 partners; however, this signal was above the background of the negative control, syngeneic C57BL/6 pairs. Coomassie blue staining demonstrates equal protein loading. Similar results were obtained in at least three independent experiments with each cohort. d FUNCAT assay in 10-micrometre muscle cryosections from the indicated parabiotic cohorts has confirmed the selectivity of ANL-labeling of MetRSL274G proteome in settings of parabiosis. A few mono-nucleated cells with FUNCAT signal above that of the nearby tissue were identified in the C57BL/6 muscle (20× image and an enlarged overlay). These FUNCAT + cells were not MetRSL274G leukocytes, as per negative GFP immunostaining (red). Scale bar, 100 μm. Similar results were obtained in three old C57BL/6 mice independently parabiosed to young MetRSL274G mice and analyzed by FUNCAT. e Proliferation rates of old C57BL/6 satellite cells were compared in culture, in presence of serum from young MetRSL274G mice that were administered with ANL in vivo versus the serum from old C57BL/6 mice. Shown are means and SD; N = 3, P < 0.05 (two-tail Student t-test). f Muscle regenerative index (the numbers of proliferating Ki67 + Desmin + myogenic cells) at 3-days post CTX injury; all parabionts were administered ANL in vivo. Representative immunostaining images are shown in right panels and quantification of the percent in vivo myogenic cell proliferation normalized to the percent myogenic cell proliferation in young muscles that is set at 1 (dashed line), is shown in the left panel bar graph. Shown are means and SD. N = 3, P = 0.426908 (two-tail Student t-test). C57BL/6 versus young MetRSL274G. Scale bar, 100 μm

