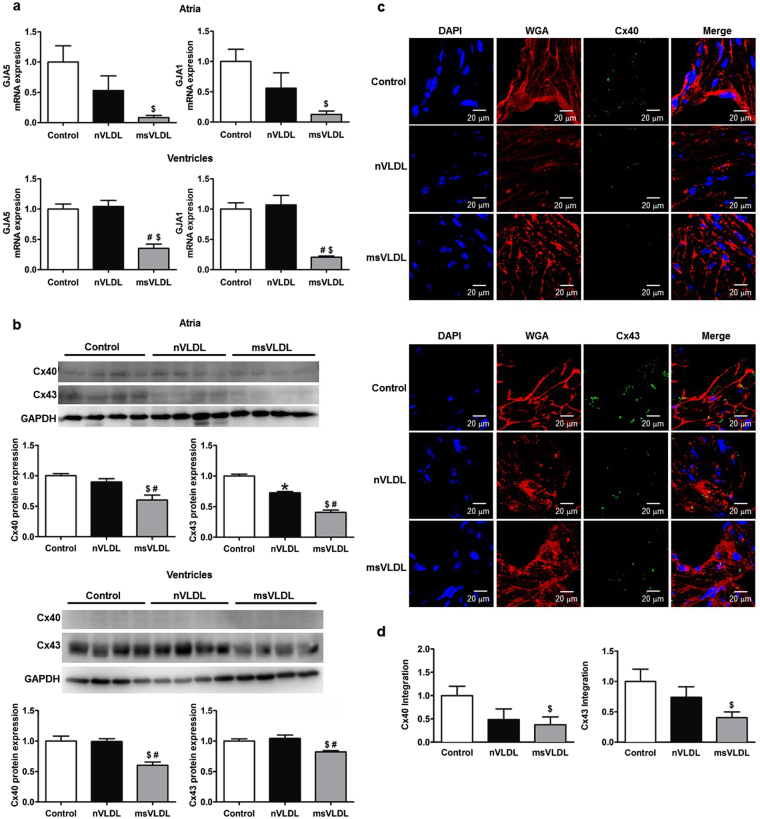
Figure 2.
The transcriptional, translational and tissue expression of Cx40 and Cx43. (a) Results of real-time PCR of GJA5 and GJA1 in atrial and ventricular tissues. For atria (n = 3 for each), GJA5 $P = 0.0028 and GJA1 $P = 0.014 for GJA1; msVLDL vs control. For ventricles (n = 5 for each), GJA5 #P = 0.0005, msVLDL vs nVLDL; $P = 0.0003, msVLDL vs control; GJA1 #P = 0.0006 and $P < 0.0001). (b) Western blotting for atrial and ventricular expression of Cx40 and Cx43. For atria Cx40 (n = 4 for each), msVLDL vs control, $P = 0.004; msVLDL vs nVLDL, #P = 0.023. For atria Cx43 (n = 4 for each), msVLDL vs control, $P < 0.0001; msVLDL vs nVLDL, #P = 0.0004; nVLDL vs control, *P = 0.0003. In msVLDL ventricles, Cx40 and Cx43 protein reduction is significant (#P = 0.0015 and #P = 0.01 vs nVLDL; $P = 0.0067 and $P = 0.0045 vs control). (c) Immunohistochemistry of atrial tissues (n = 7 for each). Nuclei with DAPI staining appear blue. The plasma membrane with WGA staining appear red. Cx40 (upper panel) and Cx43 (lower panel) appear green. The scale bars indicate 20 µm. (d) The quantification of Cx40 and Cx43 signaling integrated from a series of confocal image sections (Cx40 and Cx43 integration). For msVLDL, Cx40 and Cx43 (0.376 ± 0.164 and 0.403 ± 0.285 folds to control) are significantly reduced ($P = 0.044 and $P = 0.043 vs control).

