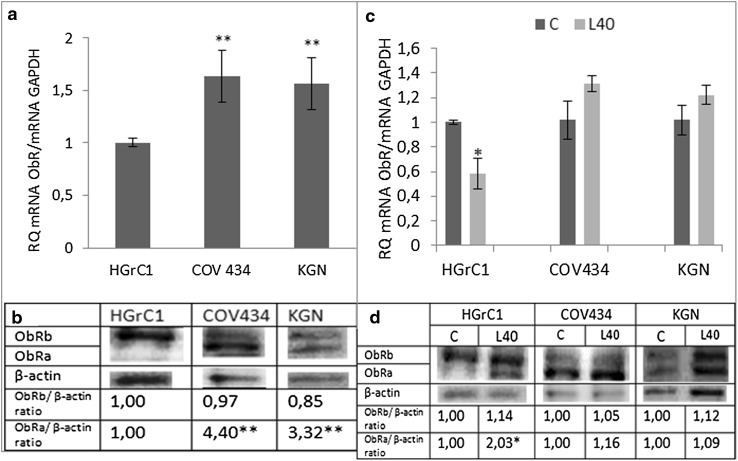
Fig. 1.
Basal expression of leptin receptor (ObR) a gene and b protein, and leptin action on ObR c gene and d protein expression in different cell lines. Basal mRNA was evaluated by qPCR after 24 h of cell culture and by Western blot after 48 h. All the results were normalised to HGrC1 (ObR expression) with a value equal to 1. Values are mean ± SEM. Statistically significant differences between groups are indicated by *(p < 0.05) and **(p < 0.01). Densitometry results were normalised to β-actin loading controls to obtain a band ratio. All values marked with **(p < 0.01) are significantly different from the control

