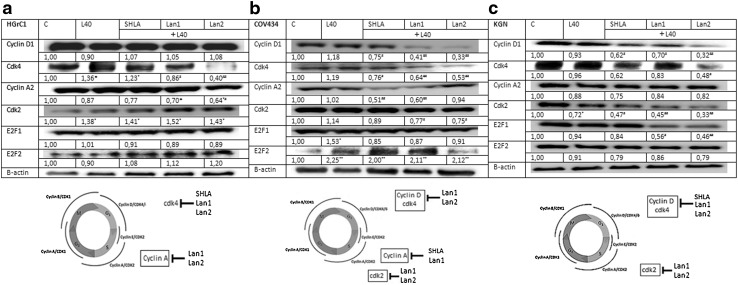
Fig. 6.
Expression of cell cycle proteins in HGrC1, COV434 and KGN cell lines under the influence of leptin and leptin receptor antagonists. The representative blots of three experiments are shown in the panels. Cdk2, cyclin A, cdk4, cyclin D and E2F1 densitometry results were normalised to GAPDH loading controls to obtain band ratios. Values are mean ± SEM. All values marked with *(p < 0.05), **(p < 0.01) are significantly different from untreated control values. All values marked with #(p < 0.05), ##(p < 0.01) are significantly different from the values of leptin at 40 ng/mL

