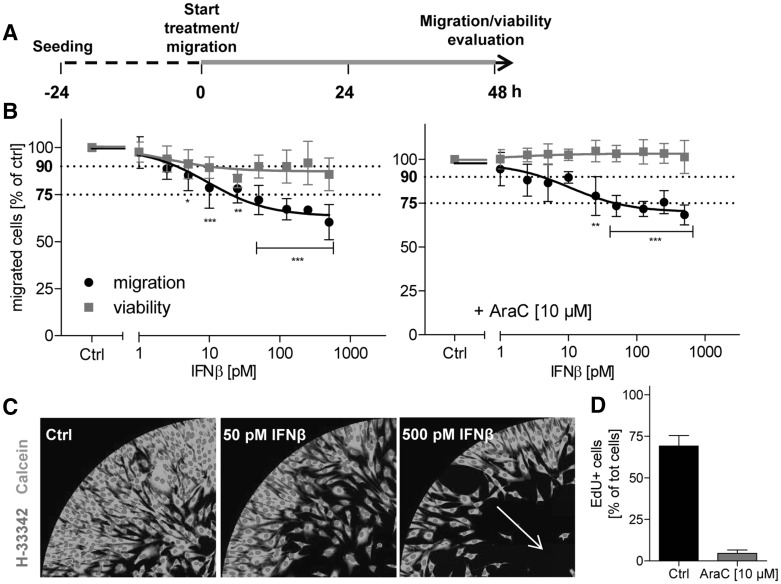
Fig. 1.
Impaired migration of NCC in the presence of IFNβ. a NCC were allowed to attach and recover for 24 h. Then, migration was started and, 48 h later, the number of migrated cells and the viability of the cell population were quantified. In standard experiments, NCC were exposed to IFNβ (marked in green) for the entire migration period. b NCC were exposed to IFNβ at the indicated concentrations. Cell viability and the number of migrated cells are expressed relative to control cells (Ctrl, 0.1% BSA in PBS). In one series of experiments (right graph), the cell culture medium used for all conditions was supplemented with the mitosis inhibitor cytosine arabinoside (AraC, 10 µM). Data are from three independent experiments. Error bars indicate standard deviations (SD). Statistics was performed for each endpoint by ANOVA, followed by Dunnet’s post-hoc test (*p ≤ 0.05, **p ≤ 0.01, ***p ≤ 0.001). Viability was considered to be impaired when it dropped below 90%; migration was considered to be impaired below 75%, compared to control (dotted lines at 75 and 90% are indicated for visual support). c Representative pictures of different migration assay exposure scenarios, taken at time 48 h. Nuclei are depicted in red (H-33342), while viable cells are shown in green (calcein). d NCC were exposed to culture medium supplemented with 5-ethynyl-2′-deoxyuridine (EdU, 10 µM) and they were treated with AraC (10 µM) or the respective control (Ctrl) for 48 h. Then, cells were stained with H-33342 (nuclei), and EdU-positive cells (EdU+) were quantified. Cell proliferation was expressed as percentage of EdU + cells out of the total number of cell nuclei. (Color figure online)

