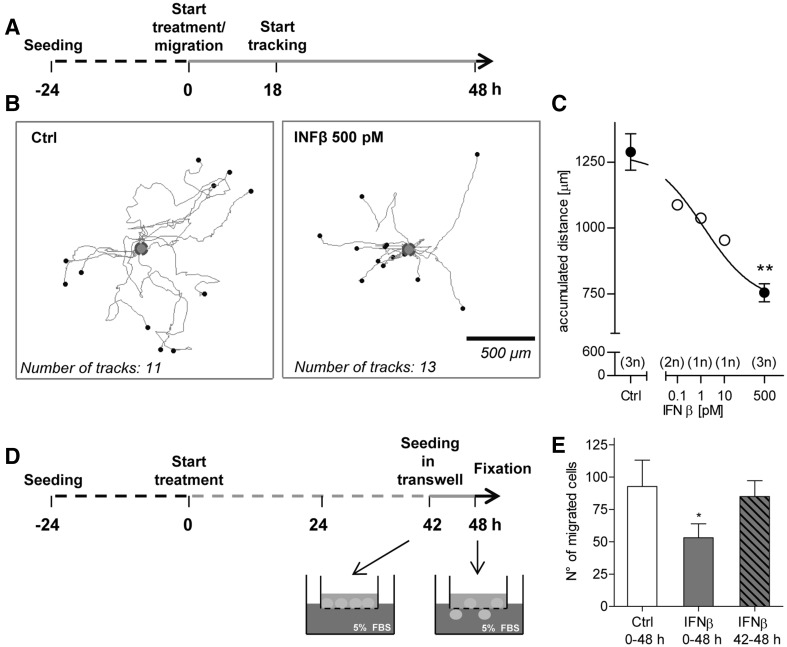
Fig. 4.
Confirmation of impaired NCC migration in the presence of IFNβ in secondary functional assays. a NCC were allowed to migrate for 48 h, and they were exposed to IFNβ at the indicated concentrations for the entire migration period. Phase contrast images were taken every 15 min during the last 30 h of migration for cell tracking. b Representative migration tracks for the control and 500 pM IFNβ-treated cells are shown. Tracks are normalized to the same starting point (blue circle); x and y dimensions are scaled similarly (see scale bar). c Averaged accumulated distance covered by the cells was then calculated for each test concentration. At least 10 cells were followed for each condition (= 1 technical replicate). The number of independent replicates for each condition is reported in the graph. Error bars indicate standard deviations (SD). Statistics is based on t test analysis between control and maximal IFNβ concentration samples (**p ≤ 0.01); an ANOVA across all data, followed by Dunnet’s post-hoc test yielded the same significance level for 500 pM IFNβ. d NCC pre-treated for 42 h with IFNβ or solvent were seeded into transwells. Then, the cells were induced to migrate through the transwell porous membrane by addition of 5% FBS into the lower chamber of the transwell, in the presence of IFNβ (500 pM) or respective control. After additional 6 h in the presence or absence of IFNβ, migrated cells were stained with crystal violet. Four fields per replicate were imaged, and the cells were counted. e Quantification of the number of migrated cells for the different conditions: the total IFNβ exposure period is indicated; data are from four independent experiments. Error bars indicate standard deviations (SD). *p ≤ 0.05. (Color figure online)

