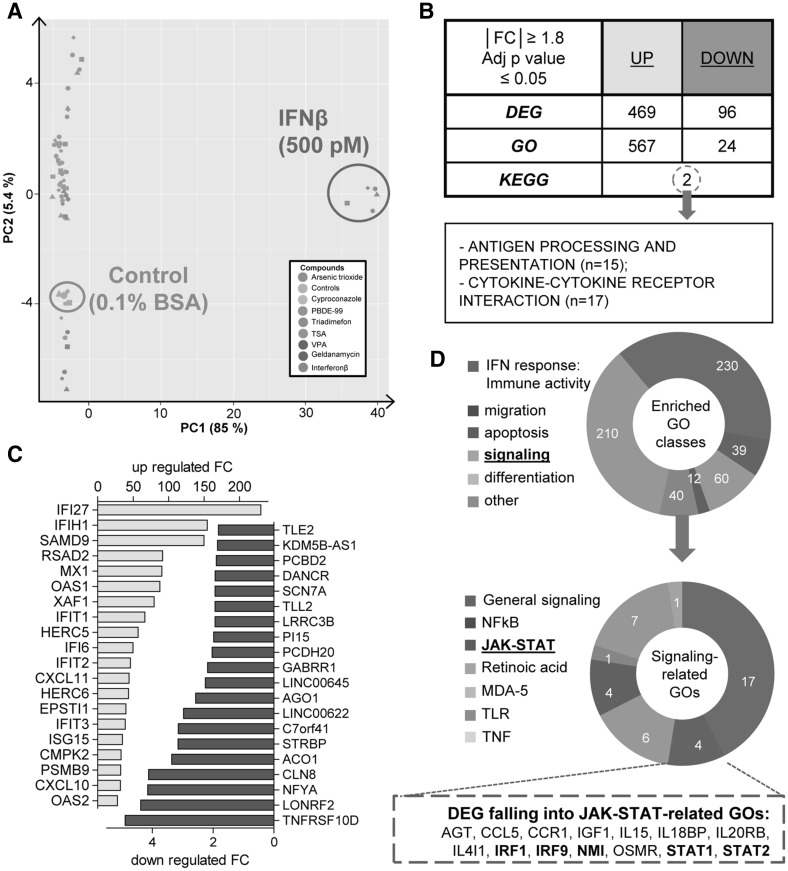
Fig. 5.
Transcriptome changes triggered by IFNβ in NCC. Sampling for microarray analysis was performed in NCC after 48-h exposure to non-cytotoxic, but migration-inhibiting, concentrations of eight test battery hits, as identified in Zimmer et al. (2014). Data are from five independent experiments (= data points of one colour, but different shapes). a Principal component analysis (PCA) was performed, and a 2D plot was generated to display the transcriptome data structure across compounds and experimental replicates. The positions of IFNβ-exposed samples, and the respective control, are circled. On the axes, the first two principal components are plotted, and the percentage of covered variances is reported. b Number of differentially up-regulated (UP) or down-regulated (DOWN) genes (DEG, IFNβ vs control) and the corresponding biological processes (over-represented GO classes) was identified. Over-represented KEGG pathways were searched amongst all DEG (UP and DOWN), and the only two significant pathways are indicated. c Identified DEG were sorted according to their p value. The top 20 up- (yellow) and down- (blue) regulated genes are shown as bar graphs indicating the fold change (FC). Large regulation factors were observed especially for genes that showed very low expression in untreated cells (as is common for transcriptome analysis of inflammatory situations). The effect is unlikely to be due to baseline variations, as the sorting was done according to the p value for the regulation. d Ring diagrams show the relative distribution of 6 superordinate biological processes (IFN response, migration/chemotaxis, apoptosis, signaling, differentiation, and other) amongst the over-represented GO classes (upper ring) and the number of the different signaling-related over-represented GO classes (lower ring). Genes with a central role in the JAK-STAT pathway are depicted in bold. (Color figure online)

