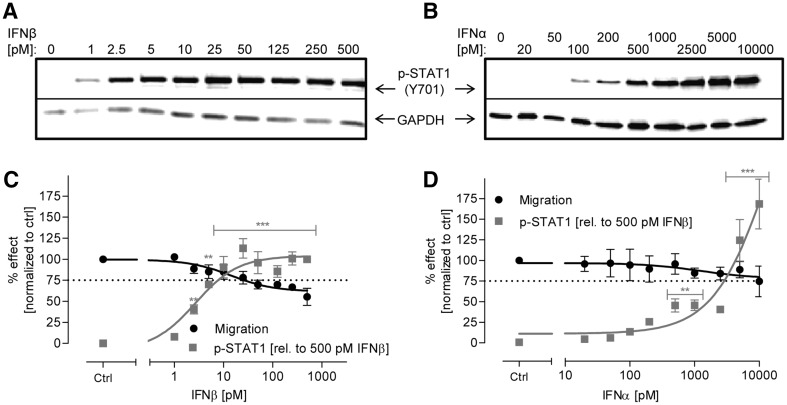
Fig. 6.
Correlation between JAK-STAT pathway activation and inhibition of NCC migration upon treatment with class I IFN. a, b NCC were exposed to the indicated concentrations of IFNβ and IFNα for 1 h. Then, cells were harvested and protein samples were prepared. The amount of phosphorylated STAT1 (p-Tyr701) was measured by western blot analysis (representative blots are shown). c, d Band intensity was quantified and normalized to the respective GAPDH antibody band. For better comparison, the migration inhibition data from Fig. 1b are shown in black in the same graph. Data are means from three independent experiments. Error bars indicate standard deviations (SD). Statistical analysis was based on ANOVA, followed by Dunnet’s post-hoc test (*p ≤ 0.05, **p ≤ 0.01, ***p ≤ 0.001)

