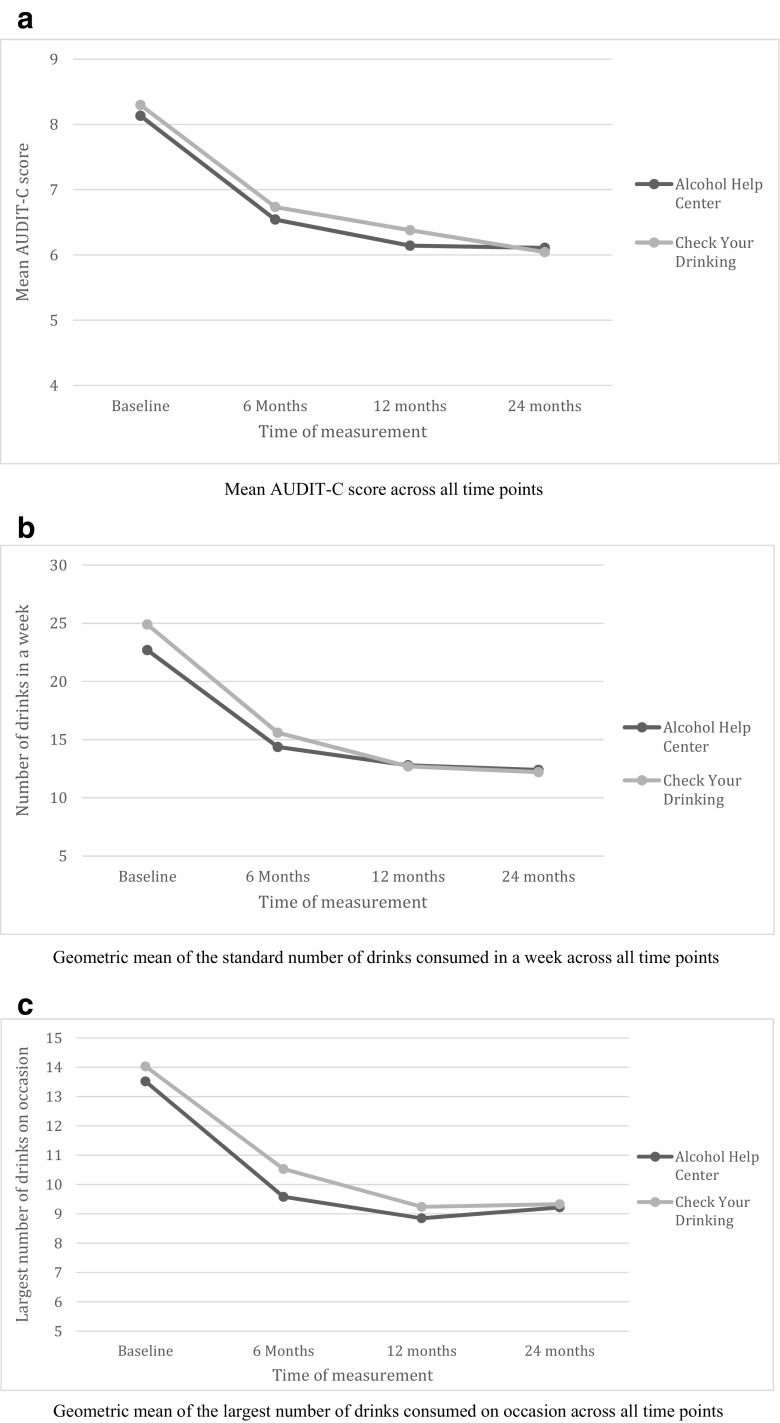
Fig. 2.
Graphs of means for the three alcohol use variables (imputed data). a Mean AUDIT-C score across all time points. b Geometric mean of the standard number of drinks consumed in a week across all time points. c Geometric mean of the largest number of drinks consumed on occasion across all time points

