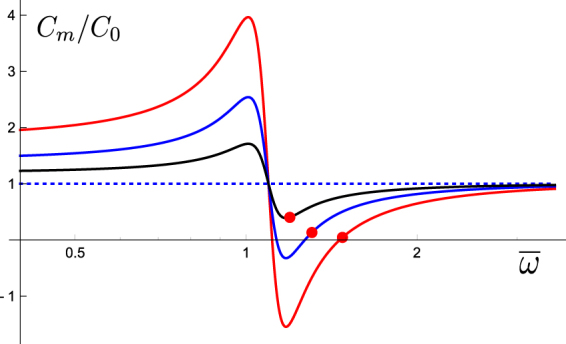
Figure 4.

Membrane capacitance near resonance. The membrane capacitance C m(=C 0 + C nl) normalized to the linear capacitance C 0 is plotted against the normalized frequency . Here the ratio ζ(=γnq 2/C 0) of nonlinear capacitance at α = 1 (load-free) and to the linear capacitance C 0 is assumed to be unity, i.e. βnq 2/4 = C 0 (Notice is maximized at ). Filled red circles indicate frequencies and the corresponding values of the membrane capacitance that maximize the power output. Other parameter values assumed are, α 2 = 1.2 and ω η/ω r = 6, which is smaller than more realistic ratios (See Discussion). Traces respectively correspond to the values of : 0.25 (red), 0.13 (blue), and 0.06 (black), showing the dependence on the holding potential. The dotted line indicates the level of C 0.
