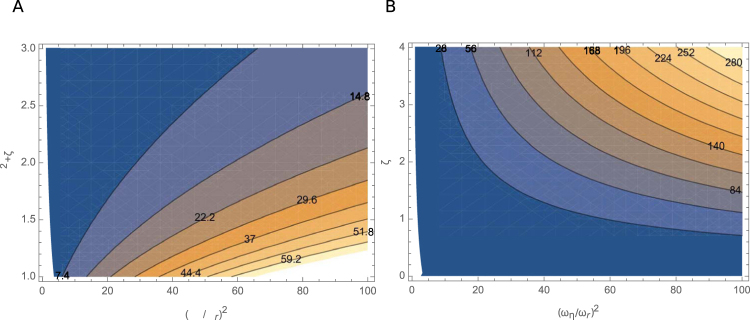
Figure 5.
Contour plots of H max and ζ 2 H max for λ = 1. (A) Contour plot of H max for λ = 1. Ordinate axis: ; abscissa: α 2 + ζ. The values of H max are indicated in the plot. Brighter shades indicate higher values. (B) Contour plot of (α 2 + ζ)ζ 2 H max assuming α 2 = 1.1, corresponding to a 10 kHz cell (see text). Ordinate axis: ; abscissa: ζ. The values of (α 2 + ζ)ζ 2 H max are indicated in the plot. Brighter shades indicate higher values.

