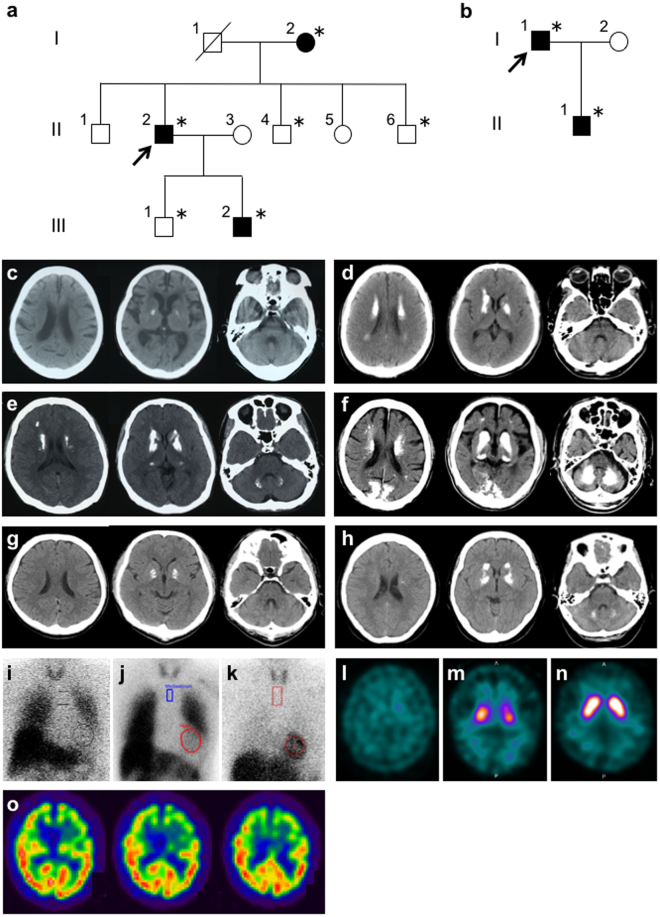
Figure 1.
Pedigrees of Family 1 (a) and Family 2 (b). Squares: males; circles: females. The arrowheads denote the probands. The filled symbols represent the subjects with calcinosis. Asterisks represent individuals who are included in this study. Brain computed tomography (CT) images demonstrating brain calcinosis in patients of this study with genetically confirmed primary familial brain calcification (c–h). (c) the proband’s mother of Family 1; (d) the proband of Family 1; (e) the proband’s affected son; (f) the proband of Family 2; (g) the proband’s son of Family 2; (h) sporadic case 1. 123I-metaiodobenzylguanidine scintigraphy in the proband of Family 1 (i), the proband of Family 2 (j), and the proband’s son of Family 2 (k). Dopamine transporter single photon emission computed tomography (SPECT) using 123I-ioflupane (l–n) in the proband of Family 1 (l) and the proband of Family 2 (m) showing a decrease of striatal tracer uptake. In the proband’s son of Family 2, tracer uptake is normal (n). Brain 99mTc-ethyl cysteinate dimer SPECT in the proband of Family 2 (o) showing a hypoperfusion in the frontotemporal lobes with a left-side predominance.

