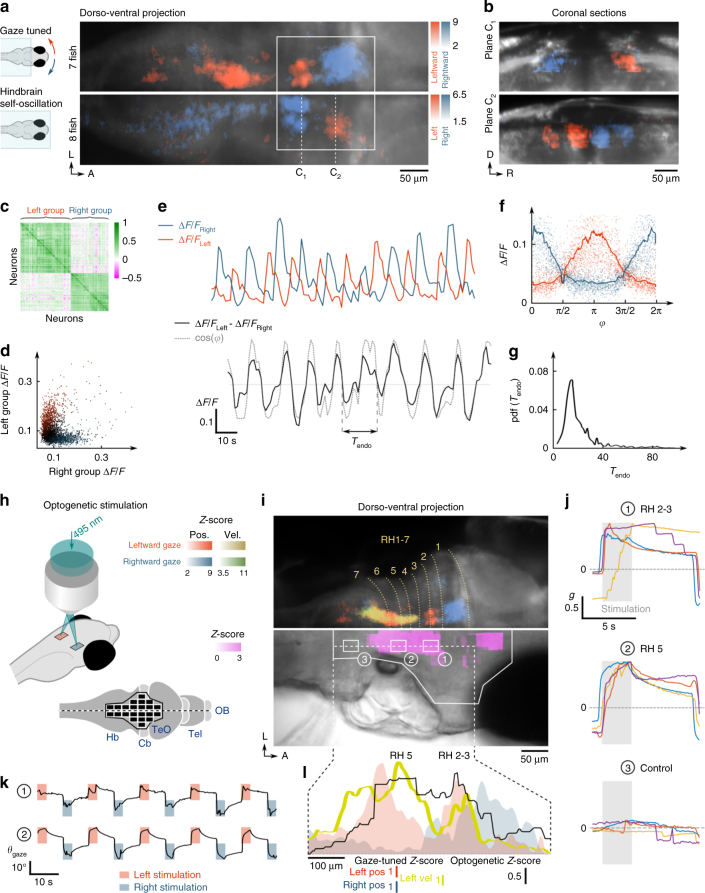
Fig. 3.
Self-oscillatory dynamics and optogenetically evoked saccades. a Dorso-ventral projection of the gaze-tuned (top-half, N = 7 fish) and self-oscillatory hindbrain population (bottom-half, N = 8 eye-fixed fish). In the latter, the colour encodes tuning to the left (red) and right (blue) pre-selected neuronal clusters, revealing strong antiphasic activity (Supplementary Methods). The two functional maps were registered on the same reference brain to enable side-by-side comparison. The rectangle indicates the region of the rostral hindbrain gaze-tuned population. b Coronal sections of the self-oscillatory population along the dotted lines in the projected view. c Pearson correlation matrix of the neurons engaged in the self-oscillatory dynamics (616 neurons). The matrix was reordered to reveal two highly correlated (and reciprocally anti-correlated) clusters. d Activity of the left vs. right populations (r = −0.43). e Example ΔF/F traces of the left and right groups (top), and of the differential signal (bottom). The grey dotted line shows cos(φ(t))), where φ(t) is the oscillatory phase extracted using Hilbert’s transform. f ΔF/F of the right (blue) and left (red) circuits as a function of the oscillatory phase. The blue and red lines correspond to the mean values. g PDF of the instantaneous oscillation period. h–k Optogenetic activation of ocular saccades. h Schematic of the optogenetic stimulation protocol. i Top: projective view of the previously mapped gaze-tuned regions. Bottom: Z-score map of saccadic entrainment by optogenetic activation averaged over 8 fish (Supplementary Methods). j Mean peri-stimulation normalised gaze signal for three regions: the rostral HBO (rh 2–3), the SGBN (rh 5), a control region (rh 7). The responses of four different fish are shown, and the associated targeted areas are indicated in (i). The 2.75 s-long stimulation periods are indicated by the grey area. k Example gaze signals upon periodic left or right optogenetic stimulation for two region pairs in rh 2–3 and rh 5. l Profile plot of the mean optogenetic Z-score along the rostro-caudal axis (black), overlaid on the ipsiversive (red) and contraversive (blue) gaze-tuned Z-score yellow curve indicates the ipsiversive velocity-tuned Z-score. Ipsiversive saccades are evoked with comparable efficiency by targeting the SGBN (rh 5) or the rostral HBO (rh 2–3)

