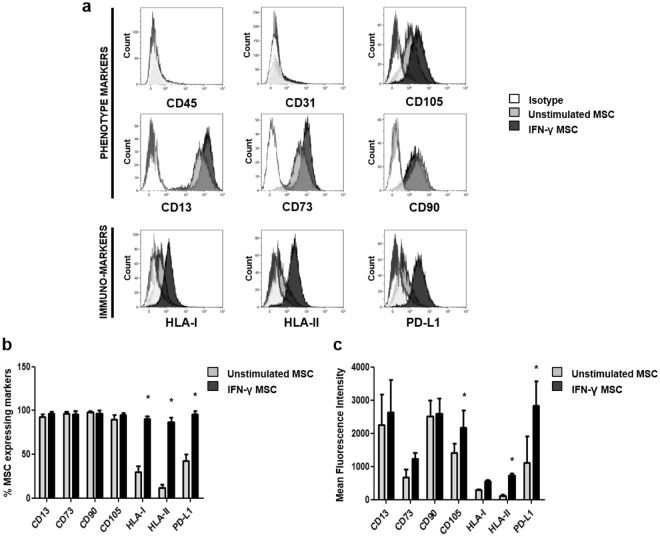
Figure 1.
Immunophenotype of unstimulated and IFN-γ stimulated AT-MSC. (a) Representative flow cytometry analysis of the commonly used markers for MSC (CD45 and CD31, both negative, and CD105, CD13, CD73, CD90), and the immune-markers HLA-I, HLA-II, and PD-L1. Isotype (white histograms), unstimulated AT-MSC (grey histograms) and IFN-γ AT-MSC (black histograms). (b) Percentage positive cells and (c) Mean fluorescence intensities (MFI) of the markers on unstimulated and IFN-γ stimulated AT-MSC. Data are presented as mean ± SD from 5 independent experiments. P values refer to the condition without IFN-γ. Unpaired t-test was used for statistical analysis.

