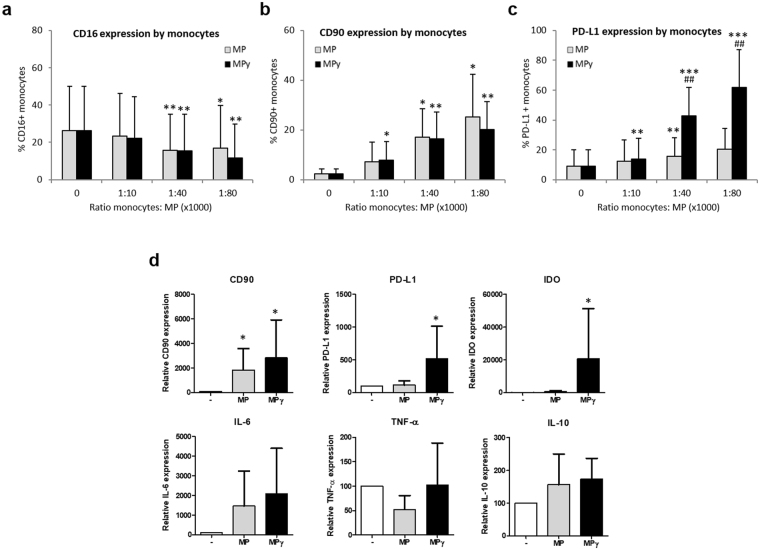
Figure 5.
Effect of MP on CD14+ cells. Monocytes were cultured with different ratios of MP for 24 h (1:10,000, 1:40,000 and 1:80,000) to determine the effect of MP on monocyte immunophenotype. (a) Expression of CD16 on monocytes cultured in the presence of MP or MPγ (n = 6; mean ± SD). (b and c) Monocyte cell surface levels of CD90 and PD-L1 in the presence of MP or MPγ (n = 7; mean ± SD). (d) mRNA expression of monocytes after culture with MP. After 24 h of culture with MP or MPγ, monocytes were separated from MP and assessed by real-time RT-PCR for CD90, IDO, PD-L1, IL-6, TNF-α and IL-10 expression (n = 6; mean ± SD). Multiple comparison test (two-way ANOVA) was used for statistical analysis, *p < 0.05, **p < 0.01 and ***p < 0.001 vs control; # p < 0.05 and ## p < 0.01 vs MP group.

