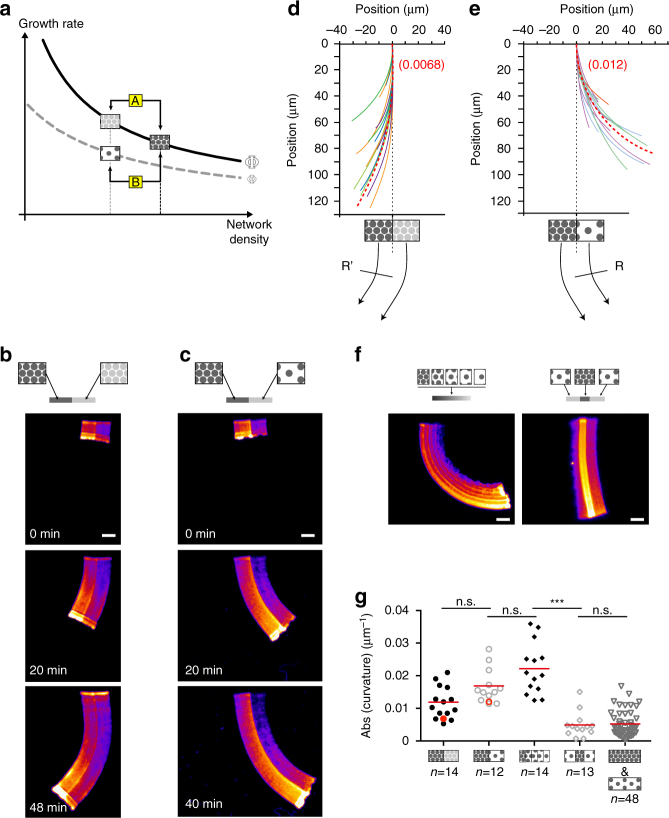
Fig. 6.
Density and geometrical organization interplay to control the steering of heterogeneous networks. a Cartoon predicting heterogeneous actin-network-growth behavior. If the two densities are generated by the same pattern family (i.e. two positions along the same curve; Case A), the steering is predicted to be always towards the denser network; if the two densities are generated by two different pattern families (two positions from two different curves Case B), the steering can be towards the sparser network. Solid curve refers to networks generated by high-spot-density patterns; dotted curve refers to networks generated by low-spot-density patterns. Double-density branched actin networks were polymerized on heterogeneous patterns. Patterns consisted either in an array of spots of the same density, with one half coated with high and the other half with low amounts of NPFs per spot b, or in an array of spots of two distinct densities both coated with the same amount of NPFs per spot c. Network curvatures, represented by the traces of the boundary between high- and low-density sides, were reported at 40 min of assembly in d, e, referring to b, c respectively. The red dashed line in d, e represents the predicted curvature according to the model. f Complex heterogeneous patterns were generated. A gradient of high- to low-spot density (left panel) or a symmetric and alternate low-high-low spot density (right panel). g LMs were polymerized on nucleation zones as indicated, and their curvature measured. High and low densities were 6.6 and 2.5 spots µm−2, respectively. Gradually sparse patterns were a series of 3 × 5 µm2 rectangles of decreasing spot density (from 8.3 to 2 spots µm−2). The “low-high-low” patterns were a series of 3 × 10, 3 × 6, 3 × 10 µm2 rectangles of 2.5, 6.6, 2.5 spots µm−2, respectively. ***p < 0.001, multiple comparison Šídák method. Scale bars are 15 µm (see also Supplementary Fig. 9)

