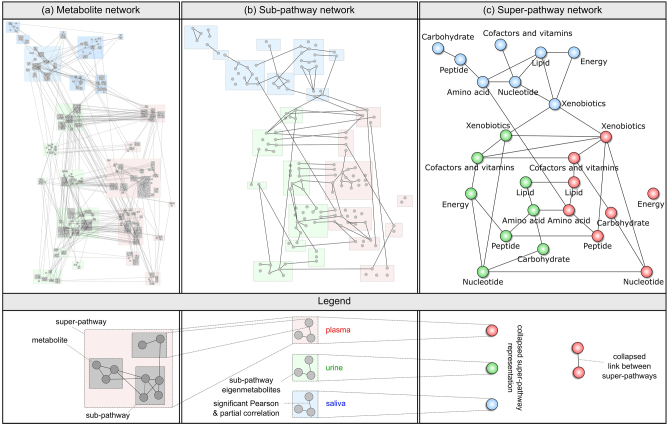
Fig. 2.
Hierarchical map of multifluid metabolic processes at a metabolite, b sub-pathway, and c super-pathway levels. In the metabolite and sub-pathway network, edges were drawn if both partial correlation and Pearson correlation were significant at α = 0.05 after Bonferroni correction for multiple testing. The super-pathway network c was generated by collapsing the sub-pathway GGM, i.e. drawing an edge between two super-pathways whenever at least one pair of their sub-pathways was connected. Note that all three networks share the same overall layout

