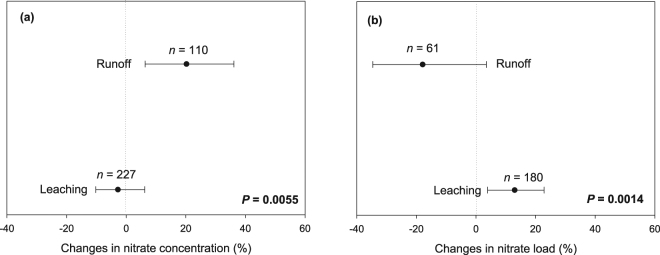
Figure 2.
The overall percentage change in the concentration (a) and load (b) of nitrate with no-till (NT) in comparison to conventional tillage (CT). Black dots represent the mean of lnR with error bar representing the 95% confidence interval (CI). A negative value indicates a reduction due to NT adoption in comparison to CT, which is only statistically significant when the CI does not overlap zero. Letter ‘n’ indicates the number of samples, P values indicate statistical difference between leaching and runoff.

