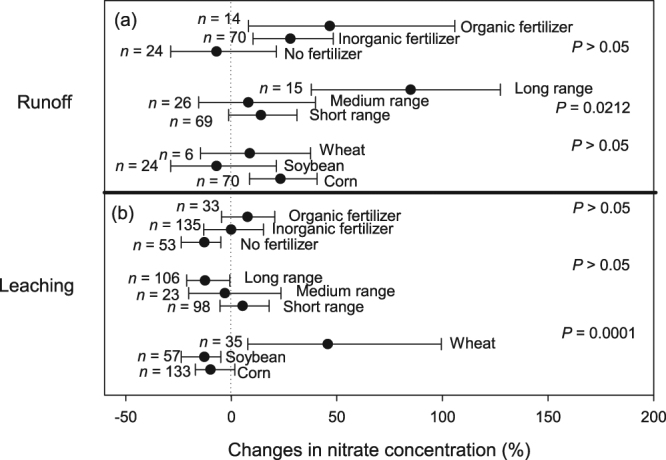
Figure 5.

Percentage changes in the concentration of nitrate through runoff (a) and leaching (b) and their interactions with different management variables. Black dots represent the mean of lnR with error bar representing the 95% confidence interval (CI). A negative value indicates a reduction due to NT adoption in comparison to CT, which is only statistically significant when the CI does not overlap zero. Letter ‘n’ indicates the number of sample, P values indicate difference within each management variables.
