Fig. 5.
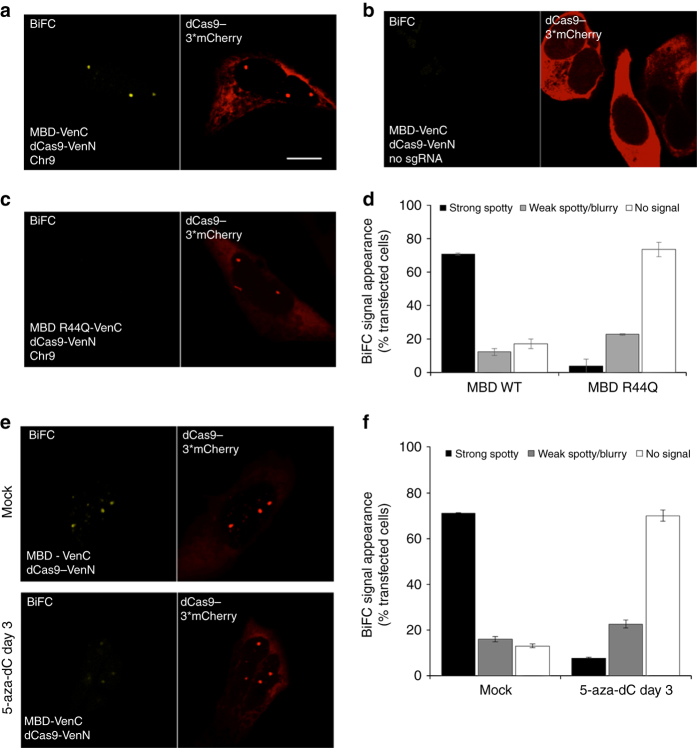
Development and validation of the BiAD sensor 3. a Representative fluorescence microscopy image showing strong and sequence-specific BiFC signal obtained with BiAD sensor 3. The locus-specificity of the BiFC signal was validated by co-transfecting the BiAD modules with a red fluorophore-tagged dCas9. b Loss of BIFC signal in the absence of the cognate sgRNA. c Loss of BiFC signal with the R44Q MBD mutant. d Quantification of the experiments representatively shown in panels a–c. e Representative fluorescence microscopy images documenting the changes in the intensity of the BiFC signal after a three-day 5-aza-dC treatment of sensor-transfected HEK293 cells. f Quantification of the experiments representatively shown in panel e. Error bars in all images represent the s.e.m. for two biological replicates (for details cf. Supplementary Tables 3, 6, and 7). All cells were fixed at 48 h after transfection. Scale bar for all images is 10 µm. The imaging and display settings of the images shown in panels a–c and within e are identical

