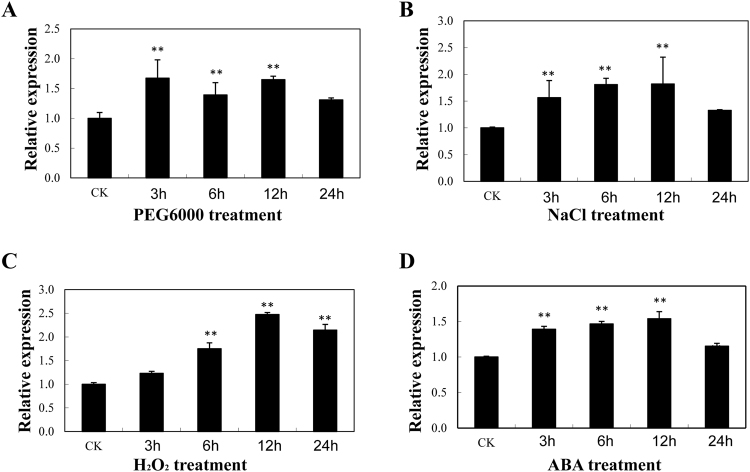
Figure 3.
The expression profiles of AnnSp2 in tomato leaves under different abiotic stress conditions. Plants were treated with (A) 15% PEG6000, (B) 200 mM NaCl, (C) 10 mM H2O2, or (D) 100 µM ABA. All samples were collected at the indicated time points (‘CK’ refers to control and ‘h’ refers to hours of treatment). The error bars represent the standard deviations of three biological replicates of each treatment. *p < 0.05, **p < 0.01. The β-actin gene (BT013524) was used as an internal control in the qRT-PCR.

