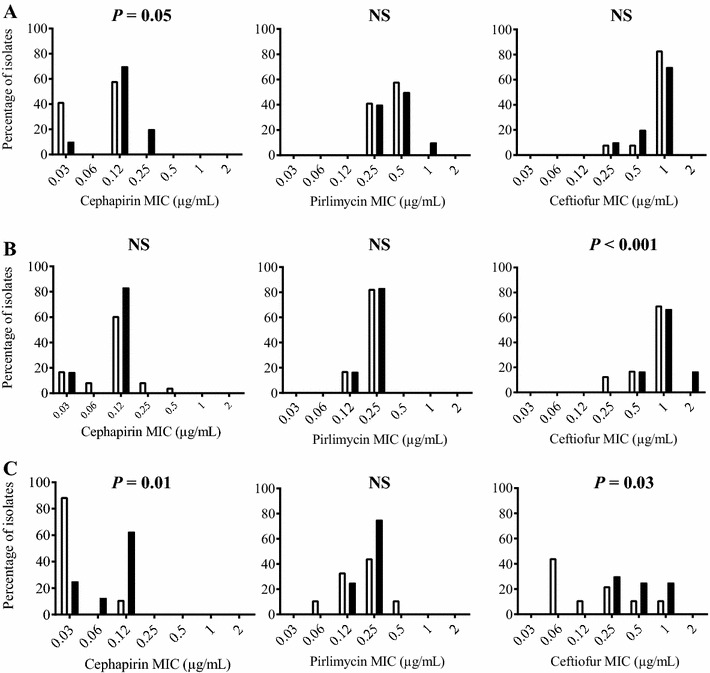
Figure 1.

Distribution of antibiotic MICs for isolates that were from cured or persistent cases. Isolates from cured cases were represented with open bars while isolates from persistent cases are represented with closed bars. Isolates were collected from an extended therapy study with cephapirin (A), pirlimycin (B) or ceftiofur (C). The distribution of the isolates from cured vs the persistent cases according to their MIC for an antibiotic was compared using a Chi square trend test: NS, not statistically significant.
