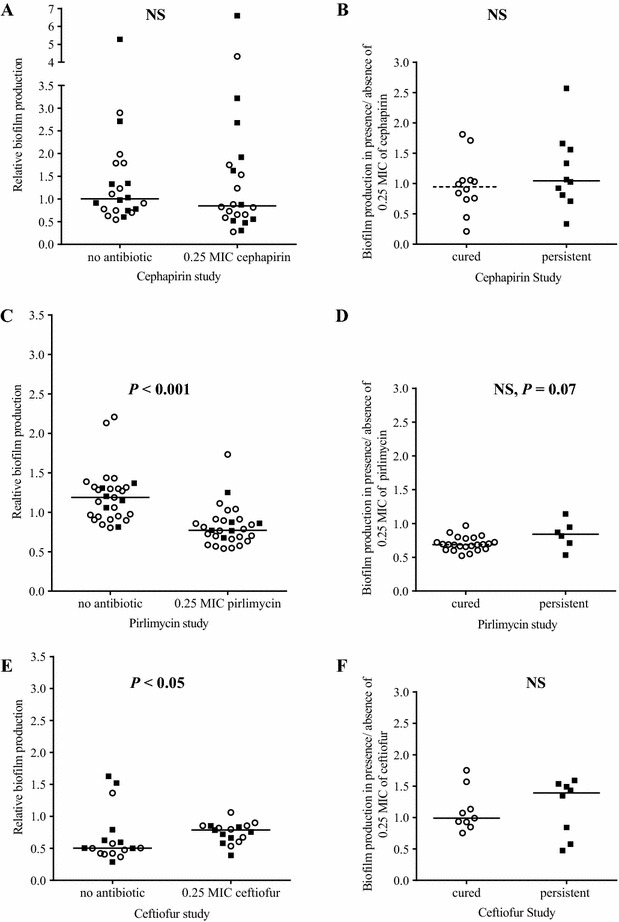
Figure 3.

Biofilm production in presence or absence of the sub-MIC of the different antibiotics. A, B S. aureus isolates collected from the cephapirin study. C, D S. aureus isolates collected from the pirlimycin study; and E, F S. aureus isolates collected from the ceftiofur study. For all graphs, open circles represent data for isolates from cured cases and closed squares represent data for isolates from persistent cases. Horizontal bars represent the medians. A, C, and E present biofilm production (relative to the S. aureus strain Newbould) for each of the isolates grown in presence or absence of the sub-MIC (0.25 × MIC) of cephapirin, pirlimycin or ceftiofur for that isolate, respectively. B, D, F present the biofilm production of each of the isolates from cured or persistent cases as determined in the presence of the sub-MIC of cephapirin, pirlimycin or ceftiofur, respectively, relative to the biofilm production of the same isolate in absence of antibiotic. Statistical analysis: Mann–Whitney: NS, not statistically significant.
