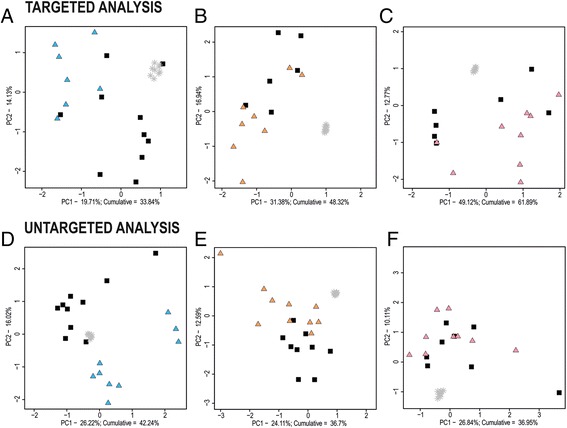
Fig. 1.

Principal component analysis score plots of targeted and untargeted metabolomic analyses. Cerebrospinal fluid (a, d), plasma (b, e) and brain tissue samples (c, f) of controls (black squares) and transgenic rats (blue, orange and pink triangles). Grey stars represent quality control samples. PC Principal component
