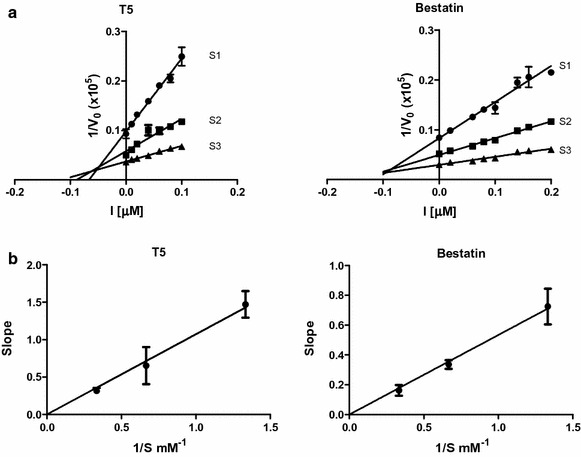
Fig. 1.

Kinetic analysis of PfA-M1 inhibition by compound T5. a PfA-M1 activity was measured with increasing Ala-pNA chromogenic substrate concentrations (S1 = Km/2, S2 = Km and S3 = 2 km) over a range of inhibitor concentrations [I], from 0.01 to 0.1 μM. Dixon linearization plots are shown for PfA-M1 enzyme versus T5 or bestatin. b Competitive inhibition was assessed by plotting the slope of the primary Dixon plot versus the inverse of the substrate concentration and was inferred by the straight line passing through the origin. Results are presented as the mean ± SEM from three independent measurements
