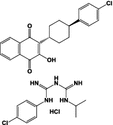
Table 1.
Summary of in vitro and in vivo PfA-M1 inhibitors properties
| Structure | Ki rPfA M1 (nM) | Ki rPfA M17 (nM) | IC50 in vitro (µM) | In vitro strain | In vivo model | In vivo parasitaemia reduction (%) | References | |
|---|---|---|---|---|---|---|---|---|
| CHR-2863 |

|
1413.41 ± 123.74 | 75.96 ± 22.86 | 0.37 | 3D7 | P. c. chabaudi/C57/BL6j | 43% (25 mg/kg) | [46] |
| 0.376 | K1 | |||||||
| 52% (50 mg/kg) | ||||||||
| 66% (100–50 mg/kg) | ||||||||
| Bestatin |
|
1673.00 ± 238.05 | 613 ± 201.33 | 5 | 3D7 | P. c. chabaudi/8 weeks old C57/BL6j | 34% at 100 mg/kg, twice a day | [46, 47] |
| 12–21 | Dd2 | |||||||
| 25 ± 1.2 | 11–15 | D10 | ||||||
| 8–14 | 3D7 | |||||||
| Malarone |

|
NA | NA | – | – | P. c. chabaudi/C57/BL6j | 100% at 14 mg/kg | [46] |
| Chloroquine |

|
– | – | 10.1 ± 3.8 | 3D7 | P. c. chabaudi/8 weeks old C57BL/6j | 85% at 5 mg/kg | [47] |
| 138.0 ± 21.1 | FcB1 | |||||||
| Compound 4 |

|
79 | 13.2 ± 0.5 | 20–40 | Dd2 | P. c. chabaudi/8 weeks old C57BL/6j | 92% at 100 mg/kg, twice a day | [31, 47] |
| 46–75 | D10 | |||||||
| 24–62 | 3D7 | |||||||
| T5 |

|
50 | > 100 µM | 11.2 ± 3.4 | 3D7 | P. c. chabaudi/BALB/c | 44 and 40% at 12 and 24 mg/kg/day | this work |
| 6.5 ± 2.4 | FcB1 |
NA data not available
