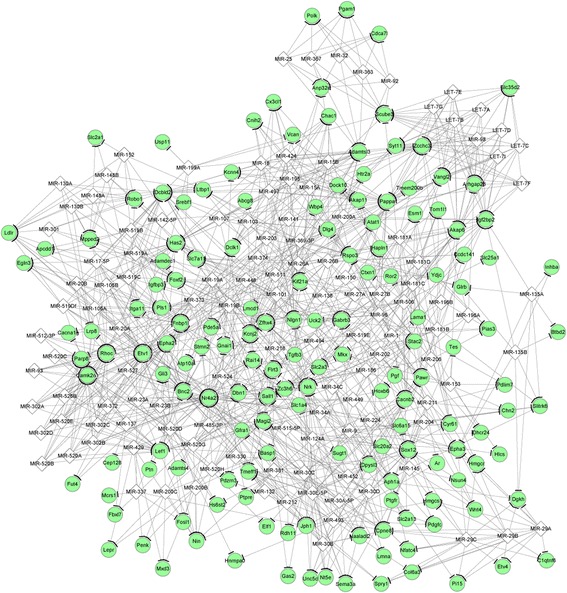
Fig. 5.

The miRNA-gene regulatory network for the downregulated genes visualized using Cytoscape software. The interactions of miRNAs-gene were predicted by WEB-based gene set analysis toolkit tool, and regulatory network was visualized using Cytoscape software. Green circles and white quadrangles represent downregulated genes and miRNAs, respectively
