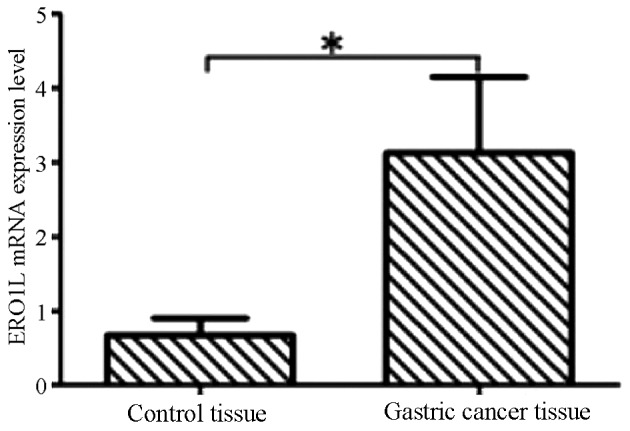
Figure 1.

Analysis of ERO1L mRNA levels in control and gastric cancer tissues by reverse transcription-quantitative polymerase chain reaction. Data are presented as the mean + standard deviation. *P<0.05. ERO1L, endoplasmic reticulum oxidoreductin-1-like.
