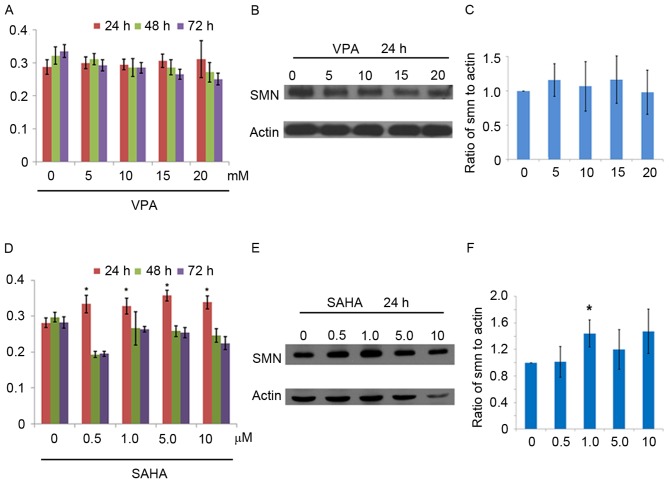
Figure 2.
VPA and SAHA interventions in SMA-01 urine cells. (A) Detection of SMN protein in VPA-treated groups at 24 h, 48 h and 72 h by SMN-specific protein cell immunoassay. Data in the graphs are presented as the mean ± SD. (B) Western blot of SMN expression in VPA-treated groups. (C) Quantification of SMN expression in VPA-treated groups following 24 h incubation. SMN protein expression is presented as the mean ± SD percentage relative to actin (%): 0 mM, 100%; 5 mM, 115.9±23.7%; 10 mM, 106.7±36.1%; 15 mM, 116.5±34.3%; 20 mM, 98.0±32.0%. (D) Detection of SMN protein expression in SAHA-treated groups by SMN-specific protein cell immunoassay. (E) Variation of SMN levels following 24 h incubation with SAHA. (F) Levels of SMN were quantified and expressed as the mean ± SD percentage relative to actin (%): 0 µM, 100%; 0.5 µM, 101.3±23.3%; 1 µM, 144.1±20.2%; 5 µM, 119.8±30.0%; 10 µM, 147.3±33.5%. *P<0.05. SD, standard deviation; SMA, Spinal muscular atrophy; SMN, survival motor neuron 1.

