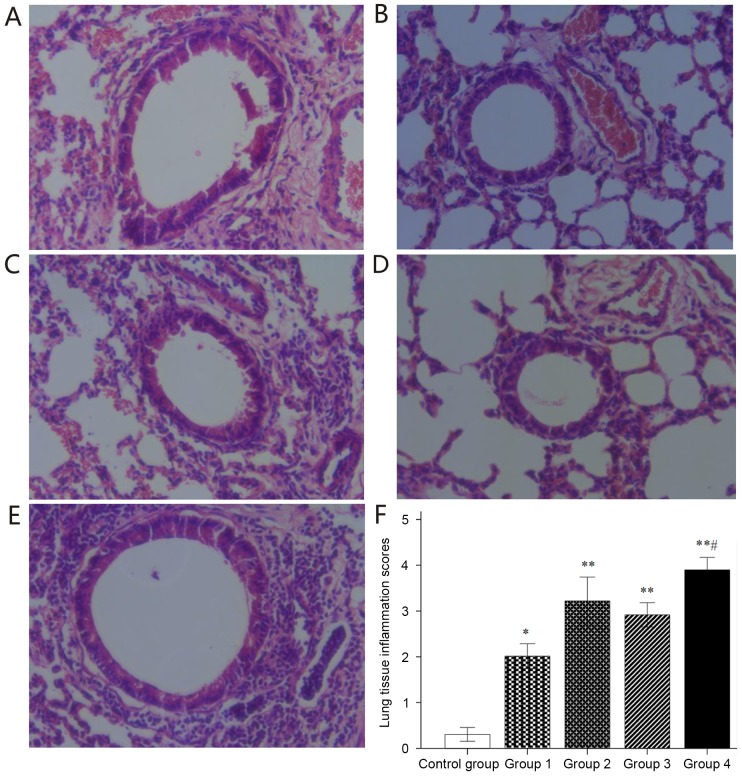
Figure 4.
Histological lung tissue structural changes and inflammatory infiltrate after hematoxylin and eosin staining. (A-E) Representative lung tissue sections for (A) Control and groups (B) 1, (C) 2, (D) 3 and (E) 4 (magnification, ×40). (F) Histological inflammation scoring. Values are expressed as the mean ± standard deviation. *P<0.05, **P<0.01 compared with control group; #P<0.05 compared with groups 1–3. Groups: 1, 50 µg HDM + 50 µg OVA + 15 µg LPS; 2, 50 µg HDM + 100 µg OVA + 15 µg LPS; 3, 100 µg HDM + 50 µg OVA + 15 µg LPS; 4, 100 µg HDM + 100 µg OVA + 15 µg LPS; control, saline only. HDM, house dust mite allergen; OVA, ovalbumin; LPS, lipopolysaccharide.

