
Figure 3.


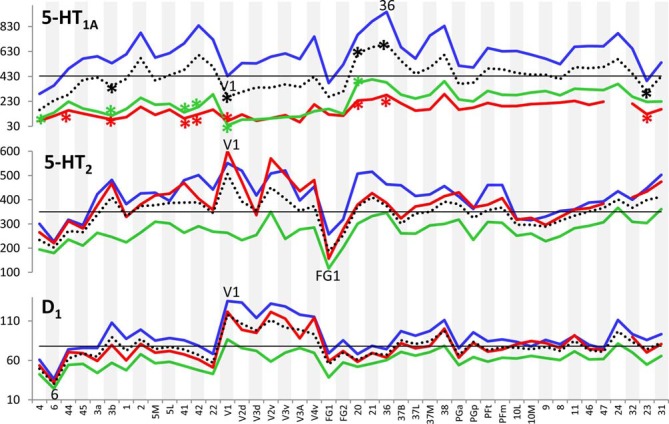
Absolute densities (fmol/mg protein) of each of the studied receptor types in 44 cortical areas. Dotted line: mean areal receptor density; blue line: receptor density in the supragranular stratum; red line: receptor density in the granular stratum; green line: receptor density in the infragranular stratum; straight black line indicates the mean areal density of each receptor averaged over all 44 areas. Areas with maximal or minimal mean areal receptor densities are indicated by their names in the respective graphs. In the case of the nicotinic α4β2 receptor, the absolute density of this receptor in the granular stratum of the three primary sensory areas (V1, 3b and 41) is highlighted. Asterisks indicate maxima and/or minima in the densities of supragranular (in blue), granular (in red), infragranular (in green) or all layers (in black) which differ significantly from the mean density of the given receptor averaged over all examined areas.