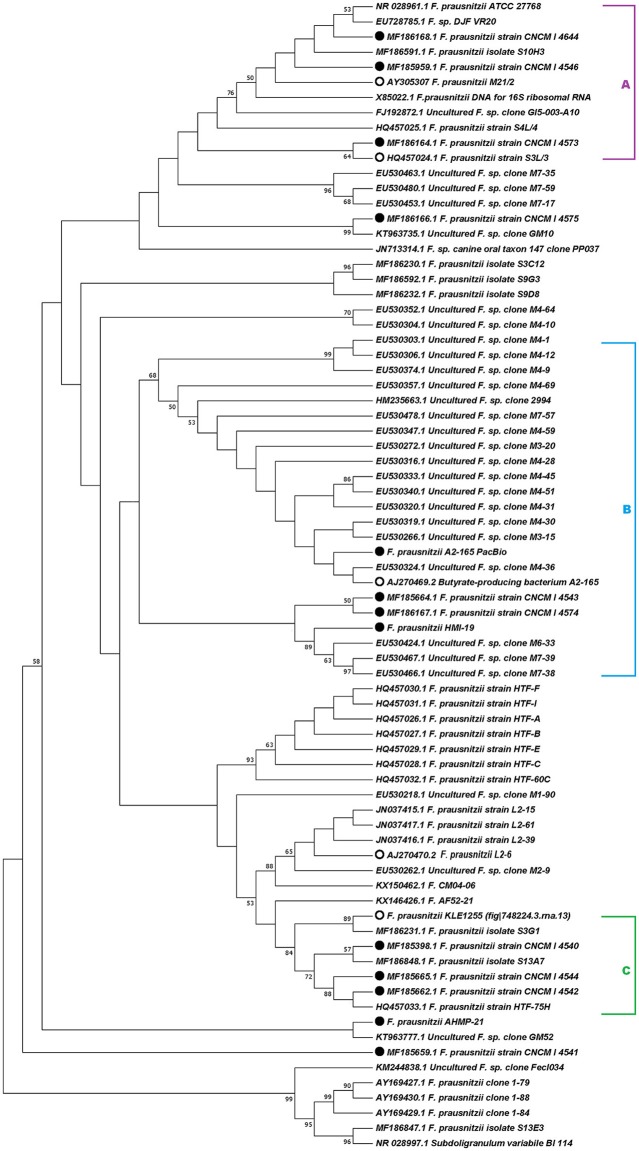
Figure 1.
Phylogenetic analysis based on 16S rRNA gene sequences. Evolutionary history was inferred using the maximum-likelihood method based on the Kimura 2-parameter model (Kimura, 1980). The topology of the tree with the highest log likelihood (−3,562.92) is shown. The percentage of trees in which the associated taxa clustered together is shown next to the branches. A discrete Gamma distribution was used to model evolutionary rate differences among sites [5 categories (+G, parameter = 0.1122)]. The tree is drawn to scale, with branch lengths measured as the number of substitutions per site. The analysis involved 76 nucleotide sequences. All positions containing gaps and missing data were eliminated. The bootstrap analysis was performed with 1,000 replicates. Evolutionary analyses were conducted in MEGA7 (Kumar et al., 2016). Accession numbers of 16S rRNA sequences are given in parentheses. Filled circles indicate the strains newly sequenced for this study and open circles indicate the strains retrieved from PATRIC for genomic analysis.

