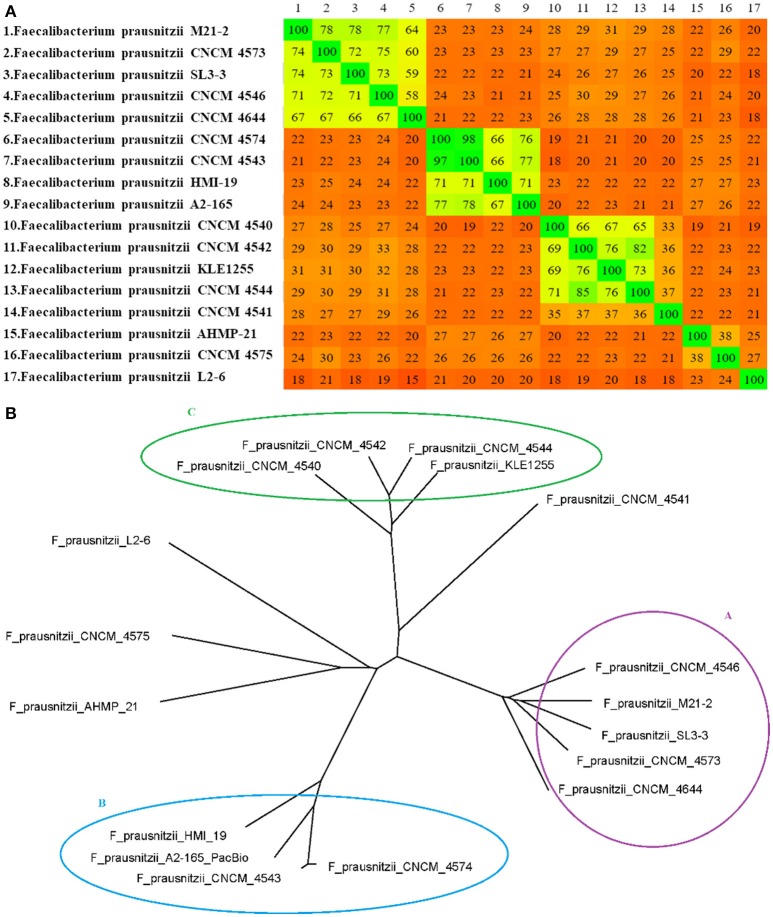
Figure 2.
(A) Heatmap and (B) distance-matrix-based phylogenetic network of F. prausnitzii. The numbers in the heatmap show the percentage of similarity between genomes; the colors vary from red (low similarity) to green (high similarity). The network was constructed using SplitsTree software with NeighborNet and equal angle methods, based on a distance matrix from Gegenees software.

