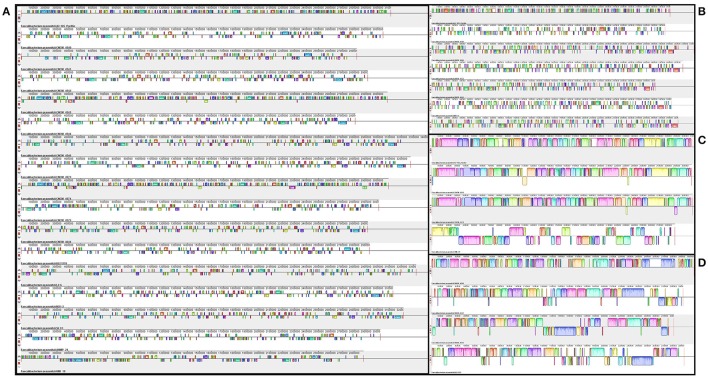
Figure 4.
Genomic synteny and gene conservation among the genomes of F. prausnitzii. The left side of the figure (A) shows the LCBs of all genomes studied here. The right side depicts the LCBs of the genomes within each of the three clusters previously obtained from ANI analysis: top right (B)—cluster A, middle right (C)—cluster B, and bottom right (D)—cluster C.

