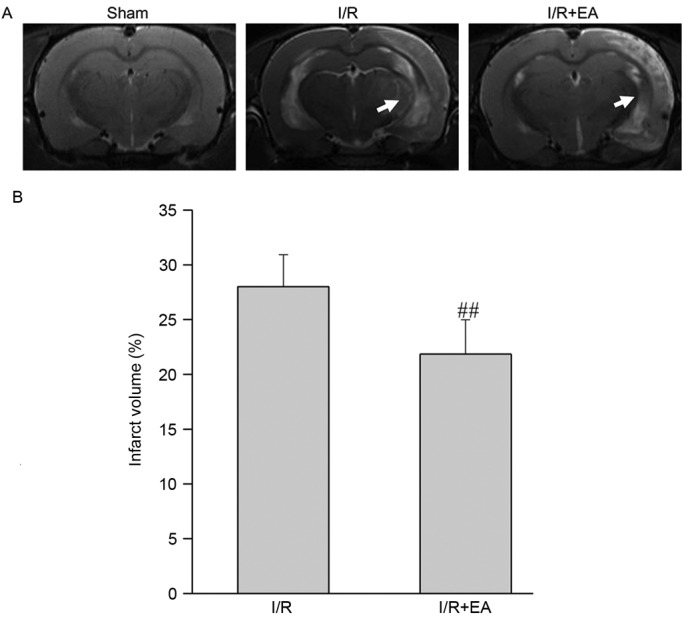
Figure 1.

Effect of EA on infarct volume. (A) T2-weighted nuclear magnetic imaging indicated cerebral infarct volume of I/R and I/R+EA groups. Red arrows indicate the infarct site. (B) Bar graph showing the infarct volume, which was quantified as a percentage of the total brain volume in each group (n=10). ##P<0.01 vs. the I/R group. I/R, ischemia-reperfusion; EA, electro-acupuncture.
