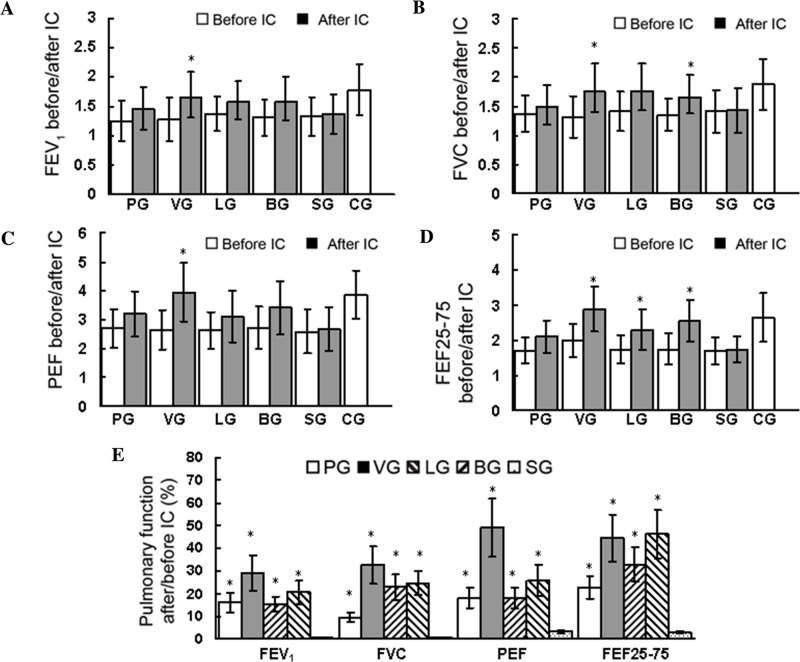
Figure 3.
FEV1, FVC, PEF, FEF25-75 and pulmonary function assessed prior to and following IC in all enrolled patients. Data are presented as the mean ± standard deviation. (A-D) *P<0.05 vs. value prior to IC in the same group. (E) Value=[(after IC-before IC)/before IC]x100; *P<0.05 vs. the same value in SG. IC, inhalation challenge; PG, pulmicort-treated group (n=10); VG, ventolin-treated group (n=10); LG, 5(S),6(R)-LXA4 methyl ester-treated group (n=10); BG, BML-111-treated group (n=10); SG, normal saline-treated group (n=10); CG, healthy control group (n=10 without IC); FEV1, forced expiratory volume in one second (L); FVC, forced vital capacity (L); PEF, peak expiratory flow (l/sec); FEF25-75, combined forced expiratory flow at 25, 50 and 75% expiratory vital capacity (l/sec).

