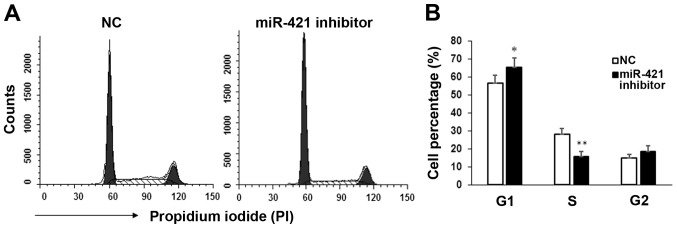
Figure 4.
Flow cytometry analysis of the cell cycle. (A) The cell cycle distribution of MKN28/MKN74 cells was analyzed by flow cytometry 24 h after transfection with miR-421 or NC. (B) Percentages of cells at G1, S and G2 phase. *P<0.05 and **P<0.01 vs. NC at each phase. miR, microRNA; NC, negative control.

