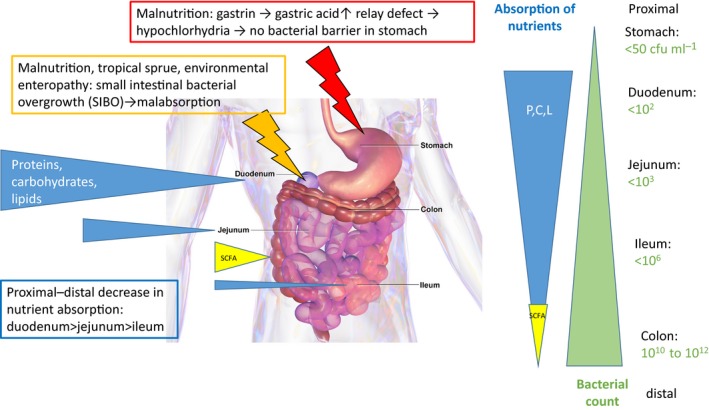
Figure 1.

The antiparallel gradient of absorption capacities (blue wedges, size is proportional to absorption capacity) for proteins (P), carbohydrates (C) and lipids (L) compared to bacterial colonization (green wedge, size is proportional to titres indicated on right) along the proximal‐to‐distal axis of the human gastrointestinal tract, with the notable exception of short‐chain fatty acid (SCFA) absorption (yellow wedge) in the colon. Data from Gorbach et al. (1967). Broken arrows indicate two pathological conditions that interfere with the distribution of bacterial colonization along the gastrointestinal tract: low gastric acid production (red symbol) and bacterial overgrowth (orange symbol) in the upper small intestine. The background anatomical gut picture is from Blausen.com staff Wikiversity Journal of Medicine.
