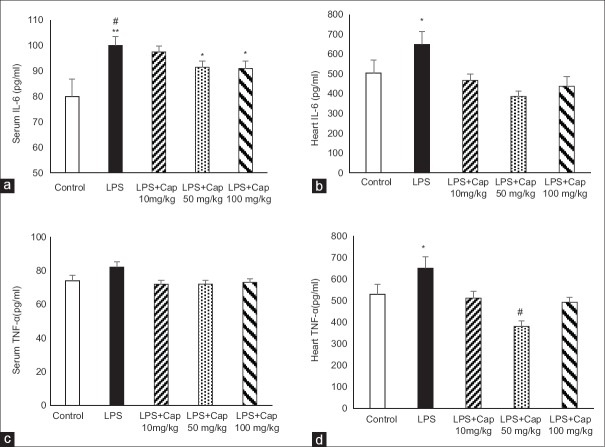
Figure 1.
Serum interleukin-6 levels in experimental groups (a and c). #P < 0.05 compared to control; *P < 0.05 compared to control and lipopolysaccharide; **P < 0.01 compared to control. (b and d) Heart tumor necrosis factor alpha levels. #P < 0.001 compare to lipopolysaccharide; *P < 0.05 compared to other groups. n = 6 each group

