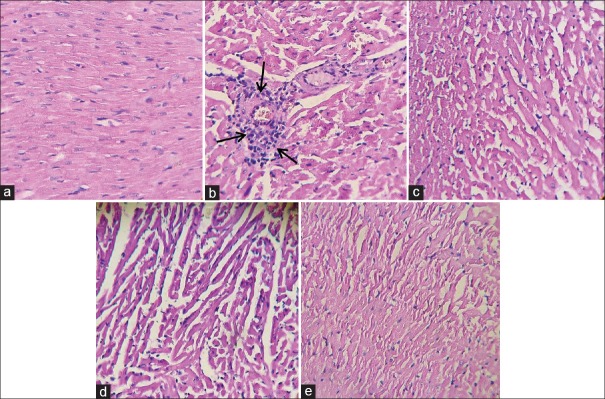
Figure 4.
The light micrograph of heart tissue stained by hematoxylin and eosin. (a) Control group with normal architecture (×20, hematoxylin and eosin). (b) lipopolysaccharide group showing infiltration of inflammatory cells (arrows) and disarrangement of fibers. Captopril reduced inflammation in the myocardium (c-e)

